The Year 7 Purple Mathematics class the students recently completed a unit on statistics focusing on dot plots which are a graphical display of data using dot pots.
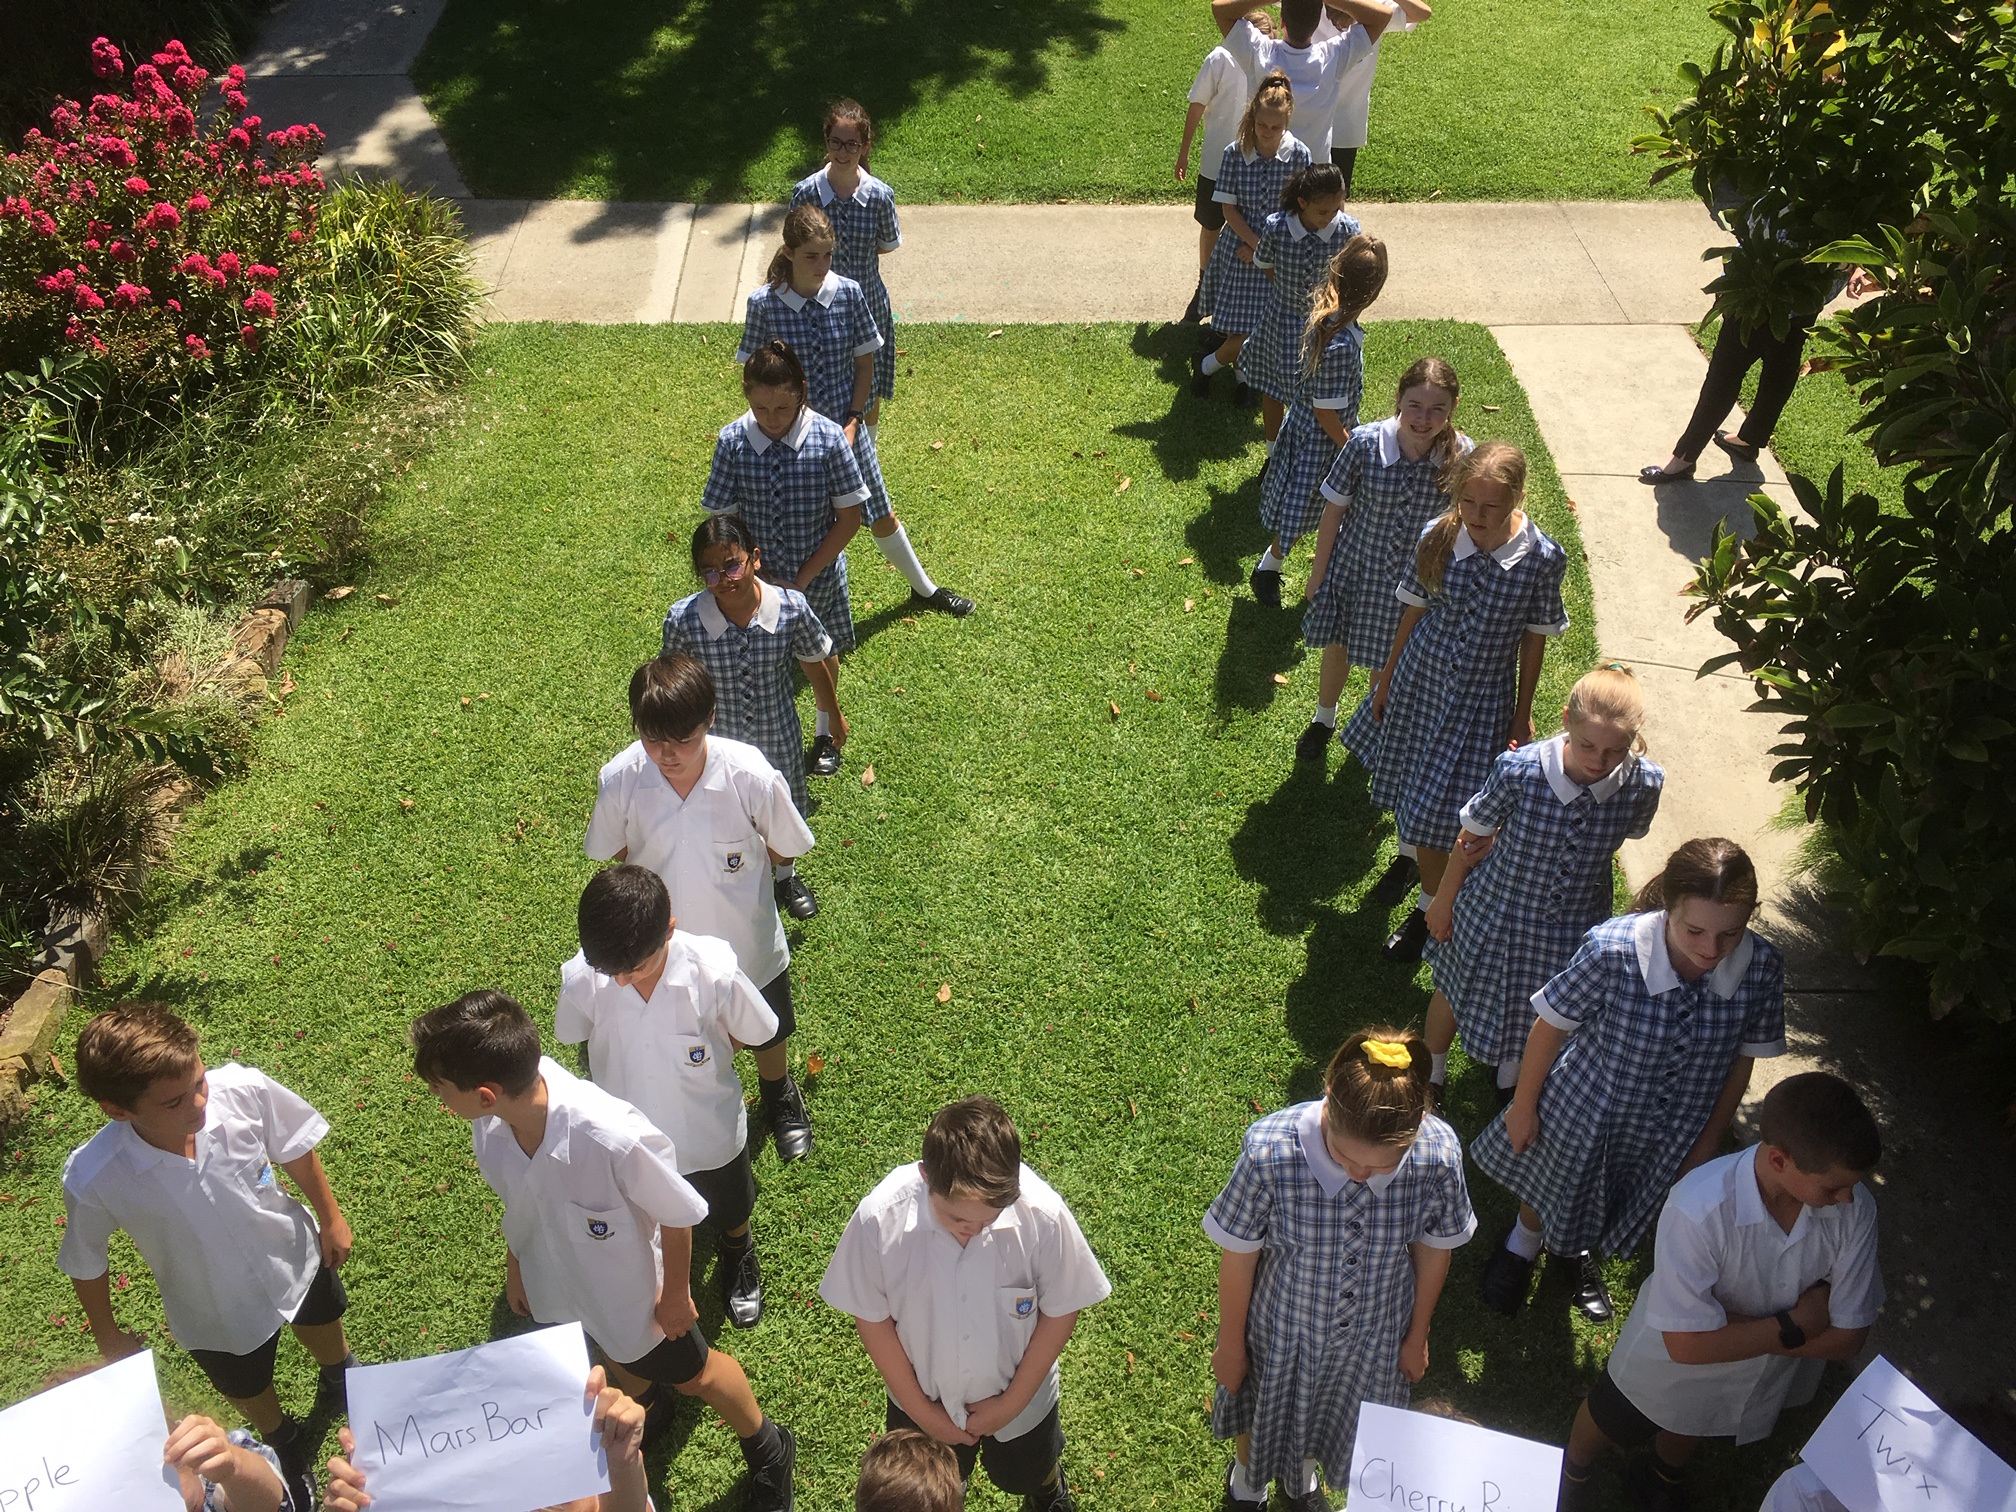
On Thursday 28 February, during a double lesson, the class decided that rather then working with dot plots from the textbook they would go and make their own human dot plot. The Class made three dot plots in total. The information collected was in response to the question ‘What is your favourite food out of an apple, a Mars Bar, a Twix, a Cherry Ripe and a Milky Way?’
The aim of this exercise was to allow the students to remember what a dot plot looks like and that they were part of one. The photos below show the the popularity of a Twix chocolate bar!